What is OEE; Overall Equipment Effectiveness
What is OEE
Overall equipment effectiveness (OEE) is a major part of any total productive maintenance (TPM) program implemented as part of Lean Manufacturing or six Sigma. OEE is a simple key performance indicator (KPI) or measure that reflects the health and efficiency of individual machines or processes.
OEE is a percentage figure calculated from three measures of how your machines or processes run; Availability, performance and quality. Note; it is only relevant for one machine or process, multiplying the figure across a plant or series of machines is meaningless.
By measuring OEE we have a clear indication of the performance of the equipment and will know what impact any changes or improvements that we make have. Without a clear measure we do not know if changes have actually resulted in an improvement.
These three measures are based on the six big losses of TPM and are detailed within the following sections.
Six Losses of OEE
The six losses of OEE are;
Availability;
- Breakdowns
- Changeovers
Performance;
- Stoppages
- Reduced Speed
Quality;
- Start Up Scrap
- Defects
These are detailed within the sections below.
Measure Equipment OEE

OEE Availability
Availability is the number of minutes within the working shift that the machine is available for production. The losses that can occur are due to your breakdowns and through your planned changeovers;
Changeovers
These are the losses in minutes due to setups and adjustments within your process, a setup being the time taken to go from the last good part of one product to the first good part of the next product.
Even when you have achieved the first good part of the next product you may not have achieved full production speed and any adjustments here causing lost time should be recorded also.
Breakdowns
These are unplanned stoppages taking more than 10 minutes (usually) and are due to mechanical (electrical, pneumatic, hydraulic, etc.) failure of some description The time taken to repair and get back to work should be recorded.
Example
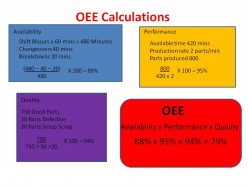
You may have an 8 hour shift which is 8x60 = 480 minutes
Your changeovers may have taken 40 minutes and your breakdowns an additional 20 minutes of downtime for a total of 60 Minutes.
Your availability then is 480-60 / 480 or 88%
OEE Performance
The machines performance is the actual speed of production vs what should be expected; normally measured in terms of output. So if you have 400 minutes of available working time and the cycle time is 1 minute then you should have 400 products, however we often experience losses in output due to running at reduced speeds or because of minor stoppages;
Minor Stoppages
These minor stoppages are often the most significant loss of productivity within your working shift, these are often difficult to measure exactly as they are frequent and take only a short period of time (less than 10 minutes.) These should be recorded on tally charts to gain an understanding of where your lost time is occurring. Typically these minor stoppages are things like clearing waste, changing tools, jams and similar minor problems and adjustments.
Reduced Speed
We also often find that we have machines running at less than design speed due to a host of issues such as worn machinery, incorrect setups and so forth. Care should be taken to not base your production rate on an unattainable speed for your process or equipment or even on a speed that is too "easy"to achieve.
Example
If you have a 30 second cycle time and you produced 800 parts in an available 420 minutes then your performance would be; 800 / (420 x 2) = 95%
Eliminate Quality Issues to improve OEE

OEE
OEE Quality
Quality for OEE is a ratio of good parts produced compared to total number of parts produced; (that is good parts plus all defectives.)
Defects
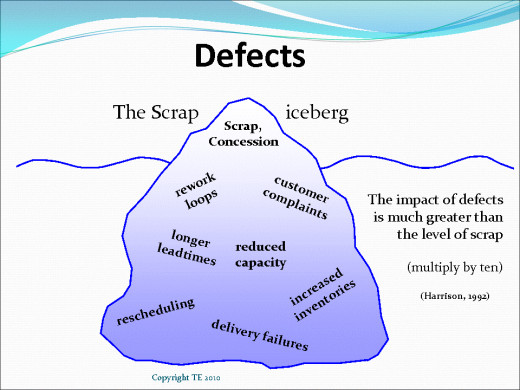
Defects are any parts that do not meet the required specifications for the process / product and could be due to a host of reasons. Use of root cause analysis tools such as the 5 whys should be used to try to eliminate the causes of defects.
Setup scrap
The unusable parts created during the setup process are also recorded within your quality calculation for OEE.
Example
If you produced a total of 800 parts in the shift but 100 of these were defective your quality percentage would be 700 / 800 = 88%
Example OEE Calculation

OEE Calculation
Your OEE is calculated from your 3 measures above; Availability x Performance x Quality as a percentage.
So using the examples above our OEE calculation would be 88% x 95% x 88% = 74%
While each of the six losses is important in its own right we express OEE as an overall figure of the performance of your equipment.
Acting on OEE
OEE (Overall equipment efficiency) like any other measure of performance is only of any value if we act on what we learn from it. OEE should be recorded graphically and the graph kept at the machine along with graphs showing the individual elements that constitute its makeup.
Kept at the workplace along with fishbone diagrams mapping out various causes of loss and action sheets recording what is being done to eliminate the various problems you can focus attention on improving your OEE.
These charts and action sheets should be the focus of regular shop floor meetings to drive continuous improvement.
Many companies that I have gone into that use OEE fail to take action, they spend significant amounts of time collecting data and plotting graphs but then do nothing with the information. OEE data is there to be acted on by your team.
OEE Video
Problems with OEE
Many performance measures can cause behavior that improves the measure but does not enhance the service to your customer; OEE is no different.
Focusing on improving OEE can cause behavior that prevents the wrong parts from being produced rather than those scheduled, for example; the cell producing those parts that are easier to produce rather than what the customer really wants. A measure of schedule attainment should also be kept or you may fall foul of this problem.
OEE should be improved through setup reduction using tools such as SMED and through eliminating minor stoppages using the seven quality tools; not through running larger batches and reducing the number of changeovers that are completed.
Operators may not want to run products that have historically higher defect rates as it will harm their OEE figure! It is important that OEE is seen as a measure that drives action and is not seen to be a measure by which punishment and blame is handed out!
Improving OEE
Only by taking action can you seek to eliminate or reduce the six losses of OEE. The best way is through regular meetings of those who use the machines supported by maintenance and other relevant staff.
The team should use the available data to review where the losses are occurring and then create a plan of action to tackle those losses. Sometimes the worst loss is not always the one to tackle first as it may be difficult or require investment. Look initially for the easiest to implement to gain as many improvements as you can before you begin to tackle those trickier problems.
As mentioned above; ensure that you look to make improvements rather than manipulate your OEE KPI by running easier products that the customer does not want or that cause you less defects.
Where to Focus Efforts to Improve OEE
Many companies make the mistake of measuring the OEE on every machine ans process in the factory and trying to improve everything at the same time. Some even make the mistake of multiplying all of the individual OEEs together to calculate an OEE for the factory; this is a meaningless measure and does not help you!
You should focus your efforts to improve on your bottleneck operations. These are the processes in front of which stock is piling up and beyond which machines are sitting idle waiting. If you can improve your bottleneck operation you will make an improvement across the whole factory. 10 minutes gained at the bottle neck is 10 minutes gained across the factory as a whole as the machines after will have 10 minutes less waiting for product.
However you should regularly review what process or machine is your bottleneck as it may well move as you make improvements to your OEE and other changes.


